Im doing some performance tests about the way the job executor behaves and i just cant find any documentation on what this “job-execution-rejected” metrics tell me.
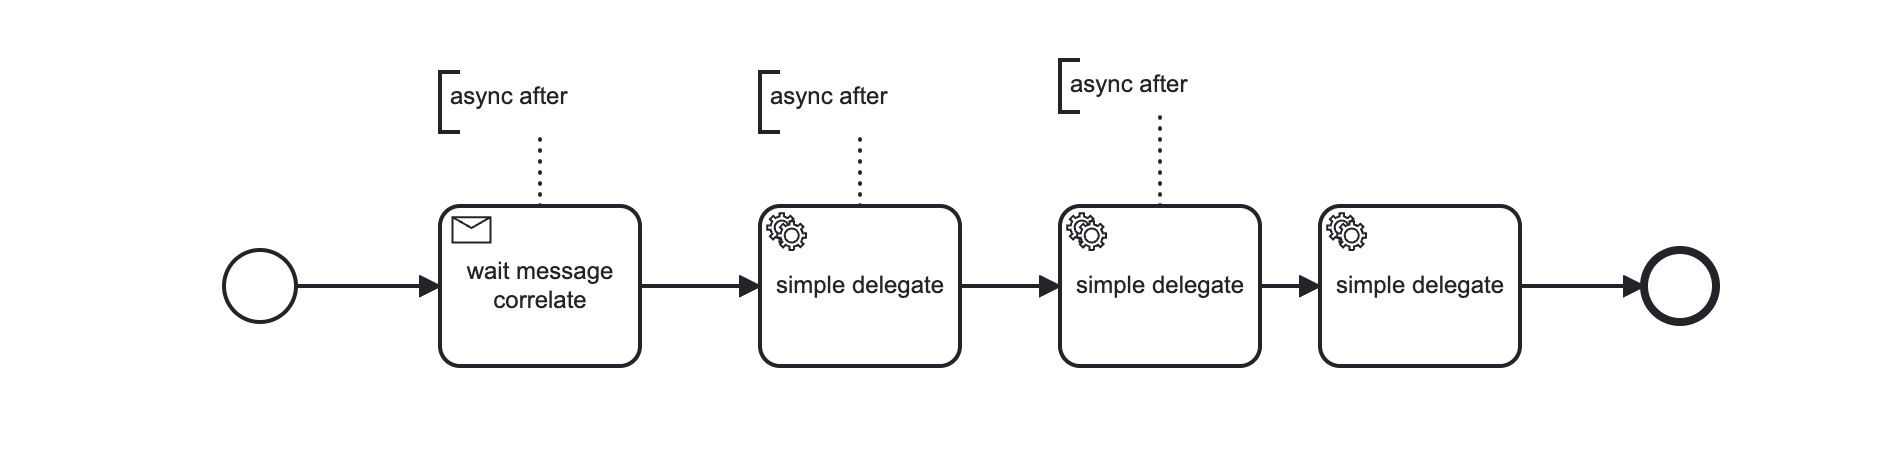
My process have a message-receiver with async after and more two delegates with async after too, so each time i correlate a message it will execute 3 more jobs.
What work is happening in your delegates, how long does it take? I think your wait-time-in-millis and max-wait are rather short (at least shorter as the default), what happens if you increase them?
I have seen this behavior if the worker threads were all occupied and there were no more left to accept new jobs. If you could share your repo, I’d be able to take a look at it.
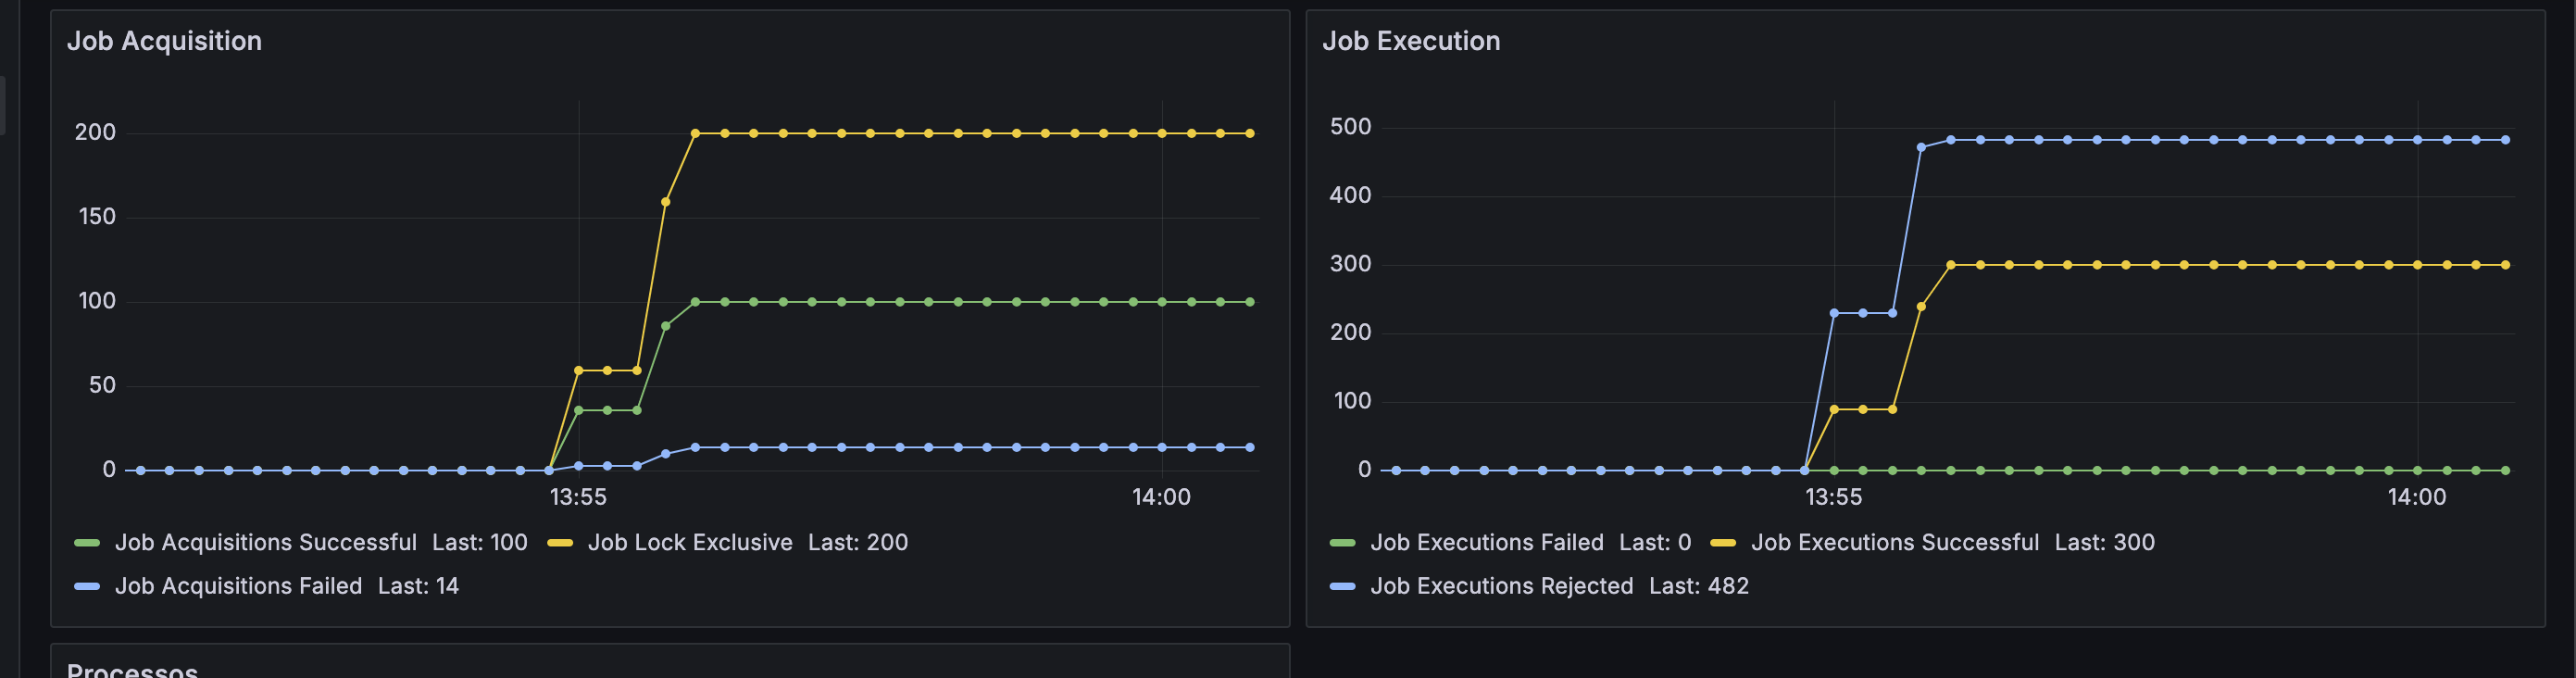
Yep, they are all exclusive. This makes my job execution success be higher than job acquisiton success, because the next exclusive jobs tend to run on the sam worker i think
yees, this is a clean environment i created only for this performance test. My database is a t3.medium postgresql instanc on aws created just for this POC project, and nothing more running on it.
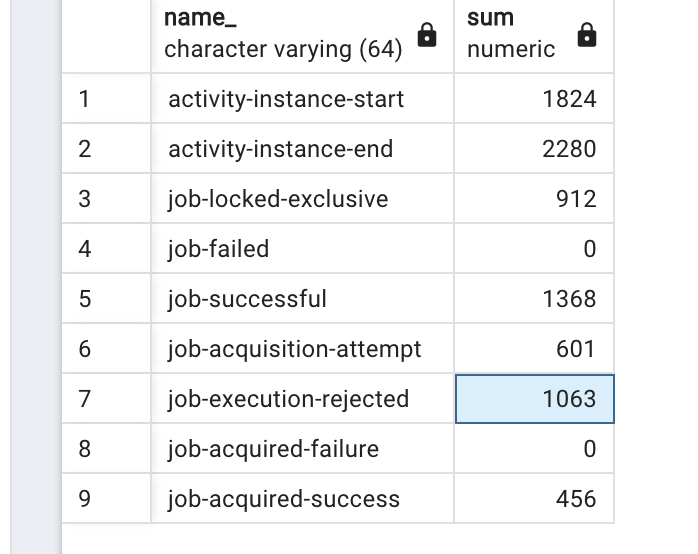
Tried again now with only one pod, to see if this was concurrency between containers, but even with a single container, core-pool-size 1, max-jobs-per-acquisition 1 i still see a large number of job reject.
I still dont understand what is ths metric…is this a issue when the job executed executes the delegate and then fail to commit the completed job? or this is an error before job executor get it?
This research topic really caught my interest! Recently, someone mentioned to me that the ‘job executor’ might be considered ‘outdated’ and could benefit from a refresh. However, he didn’t provide any specific details, so it’s up to us to dive in and build our knowledge around it. Excited to explore this area and see what improvements we can bring to the table
/**
   * Number of jobs that were submitted for execution but were rejected due to
   * resource shortage. In the default job executor, this is the case when
   * the execution queue is full.
   */
So the scheduler which cyclically queries the job execution table is not able to put the retrieved jobs into the execution queue.
As your queue is exactly the same size as your max-jobs-per-acquisition, this kind of makes sense to me.
Thanks for trying that. Currently I cannot estimate the impact of starting the messages spawning new Threads with Semaphores. At this point, I would start debugging the threads with Java FlightRecorder. Would it be possible to share a FR recording here?
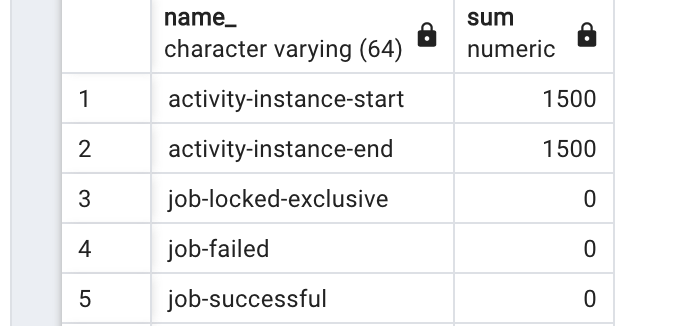
I think it can be a lack of threads caused by the semaphore + new thread. Moved it to a container with job-executor disabled, executed it again with parallel 2 and the other container executed every job without job rejects.
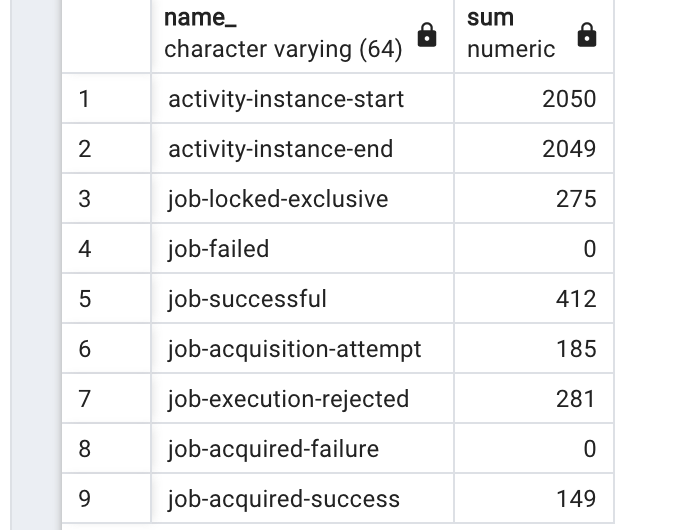
But then i tried again with 500 process instances instead of 100, and completing the messages in parallel 10 (still in other project with job executor disabled) and got too many job rejects again.
So even with no other resource wasting threads on this project, just job acquisition and job executor, it still get job rejections when we have many jobs waiting on database.
Im very curious on how it works now… if theres no thread free to execute, i was expecting the job to be waiting on the internal job queue until lock expration time, and when its full i expected job acquisition to stop acquiring more jobs.
Maybe it would be nice to dig on the source code to uderstand more of what it is and when this job execution reject behavior happen,
Im doing all these tests because im on a project that will have to execute 500k process instance like this on a single day (but with heavier java delegates), so i’m trying to understad how it works under the hood and whats the best configuration.
I was thinking about problems with multiple containers concurrency in the job acquisition, many job acquisition failed and so, but im surprised with these problems in a single container scenario
After a quick call with @amzill discussing some of the aspects here, there is one question left: Are all jobs you expect to be processed finished?
In the end, job-execution-rejected is just info from the Engine, that no thread was able to process an acquired job. This is not a bad thing per se, but a feature of the engine. The engine should react by increasing the wait time for the next job acquisition, to try and make better use of the resources.
I did not have time yet to reconstruct your example, maybe on the weekend I can get a little more hands on
This is the info iwas looking. Thanks.
I can see that every job had been executed perfectly, but i was afraid that if it was rejected, there should be some wrong configuration wasting resources, locking excessive jobs, and impact my throughput on the large data i will have in the real scenario of 500k process.
It occurs because i got more jobs on my last job acquisition polling than i have free space on the local queue?
When this job-execution-reject occurs, the job stays locked by this owner and in the local queue anyway or it clears the owner on database for other container try and lock it?
Reading through the source code, it seems the engine tries to execute the job as soon as it is acquired, and if it gets rejected only then it gets added to the current job queue.
If my reading was correct, then its very normal to occurs and isnt a problem at all as youve said @javahippie , it only says that the job queue that we configured will be used as expected (hold some jobs until any job executor thread gets free for it).
If you could share your findings, that would be amazing. Some time ago I wrote a script which progressively changed the configs of the Job Executor to see how it differed in performance.
I also switched out the job worker threads with Javas Virtual Threads as an experiment once, to remove the thread limit entirely - and it became pretty obvious that at some point the locking on the Job Executor table became the bottleneck. On the other hand I have worked with clients processing 2 billion activities a year in the process engine, those limits are not reached easily